
MOTOR-DRIVEN SYSTEMS
EFFICIENT PUMPING
Pumps are devices designed to move liquids, gasses or slurries from one place to another. In the vast majority of cases they are propelled by electric motors. It is estimated that about 40% of all the electric motors in the US is used to propel the pumps [18]. This figure makes the efficient pumping one of the most important issues in the energy conservation. There are many kinds of pumps although the most commonly used ones are centrifugal pumps (Figure 20) which constitute 99% of all the used pumps [30].
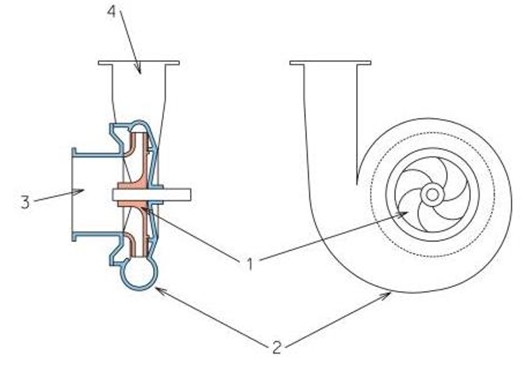
FIGURE 20: CENTRIFUGAL PUMP DIAGRAM BASED ON [33]
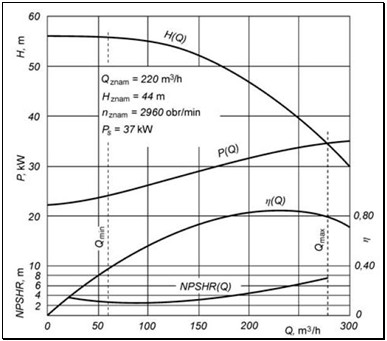
Being familiar with some basic characteristic of the pump is essential to better understand the pumps. Graph 7 shows three main characteristic of a pump. The H(Q) characteristic (known as flow characteristic) where H means delivery head which basically stands for differential of height between lower tank and upper tank where the fluid is pumped to. The P(Q) characteristic where P is an electric consumed used by the pump. The ?(Q) where ? is an efficiency of a pump. Q is a pump output rate which is an amount of fluid pumped within an hour.
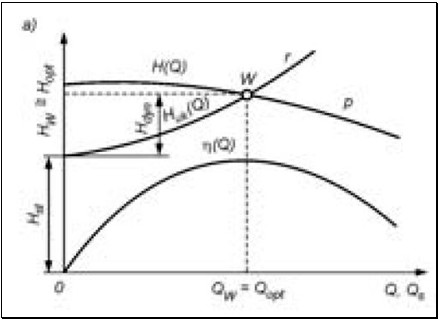
Pumps do not work alone. They need pipes which guide fluid moved by the pumps. The pipes have their own flow characteristics H(Q) which are different from the pumps ones. Graph 8 presents flow characteristics of a pump (p) and a pipe (r) as well as the efficiency characteristic. As can be seen the two characteristics cross at point W. This point is called design point and it states the parameters of a pumping system such as pump output rate, electric power or efficiency. The design point can be moved by adjusting the two flow characteristics, although it is much easier and more efficient to shift the pumps one.
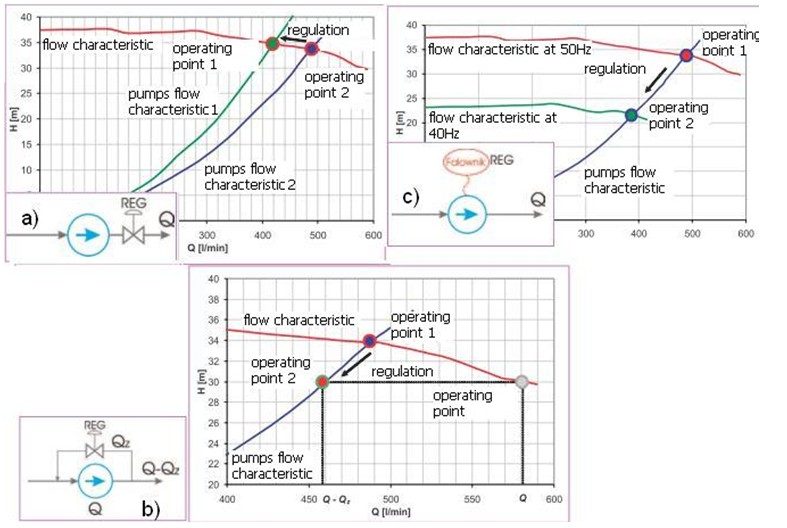
There are three techniques of shifting the flow parameters. The first and least efficient one is regulation by throttling (Graph 9, a). It requires a valve which is located beyond the outfall of the pump. The valve can regulate resistance of the pipe, thus basically to reduce the pump output rate it weakens the pipes parameters. Another method is regulation by using sluice (Graph 9, b). It can be obtained by moving back part of the fluid using a bypass pipe. The last technique is regulation by motor speed control (Graph 9, c). It can shift pumps flow characteristic by changing the motors rotational speed which can be obtained by variable frequency drives. Each of the methods has advantages and disadvantages. The first one is inexpensive but it consumes the most energy and reduces the life span of the pump. The second method does not consume as much energy as the first one but its capital costs are larger since there is a need to construct additional pipes. The most efficient technique is regulation by changing the motor speed. Admittedly frequency changers are expensive in comparison to valves and pipes, although the energy saved using that technique will payback repeatedly during the life cycle of the system.
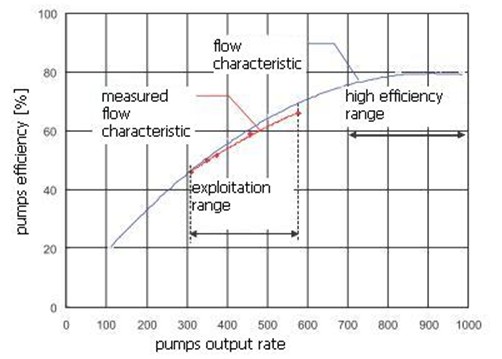
Pumps are machines which can be exploited in variable conditions. The pump output rate can be modified many times a day in a wide range. As was stated before pump output can be adjusted by the variable frequency drivers explained on chapter 3.1.4.3. As can be seen on graph 10, the pumps efficiency differs depending on the pump output rate. This is why it is important to select a pomp which will match the demands. Graph 10presents a pump which is mismatched. The pump output operating range (red) is between 300 and 580 m3/h which means that the pump works with efficiency of between 45 and 65%. The efficiency of such a pomp would be improved by about 20% if a smaller machine were used e.g. a propelling electric motor with lower rated power.
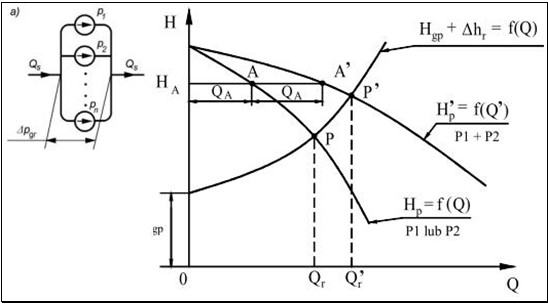
Pumping systems are designed to work in the worst case scenario. Therefore, in some cases, the operating range can be very wide. This can result in a very undesired situation when a large pump works for most of its life span with low efficiency (Graph 10). To avoid that problem it is vital to install two or more parallel pumps (Graph 11). The pump output rate of such a block is an algebraic sum of the pump output rates of all the pumps in a module. This effort allows for more efficient pumping because it is more efficient to run two smaller pumps when for example first pump is working with high ballast at high efficiency and the other one is initialized occasionally when the demands are higher.
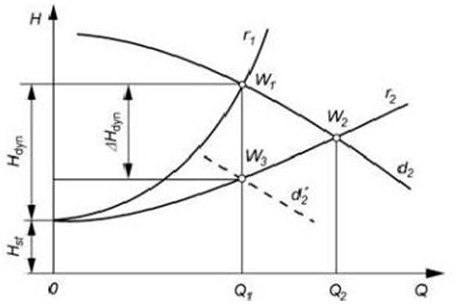
Very important issue concerning pumps is their piping condition. Pipes can be a source of additional losses caused by too small diameter of pumps, too many valves, orifices, offsets or the corrosion of the pipes. Graph 12 shows flow characteristics of the same pipe before modernization (r1) and after modernization (r2). As can be seen a modernization, that is an extension of the pipes diameter or removal of residuals causes the operating point to move from W1 to W2. This results in a growth of the pump output rate from Q1 to Q2. To keep the pump output rate constant it is required to lower the pumps flow characteristic from d2 to d2 which can be obtained by reduction of motors speed and following on that reduction of energy usage.
-
Definition of energy conservation and demand side management|
Technologies|
Financial funds|
Legislative and normative issues|
Data base
Copyrights © Arkadiusz Mysiakowski