NUCLEAR POWER INDUSTRY
Nuclear energy share
Nowadays, most of nuclear reactors are PWR (Pressurized Water Reactor) or BWR (Boiled Water Reactor) construction. They are described in TECHNOLOGY, but generally it can be assumed that all reactors, existing and under construction are produced in the same technology. Technology, which was worked out in years 50's. Even new assets based on PWR/BWR - technology is not new. The 3rd generation in reactors presents larger concerns for nuclear security. It is true that load factor of nuclear power plants increased a lot and efficiency too, but it is the achievement of series elements in all power plant circuits, not exactly of reactor. Due to that statement than even 3rd of 4th generation reactors will be new technology is not correct. New technology indicates to significant development and new quality - it can not be achieved before bringing to perfection fusion process. On a date 31 December 2009 all the world, 437 reactors has been operating with a total electrical power of 370705 MW (Fig.5.) But even not a half of them is located in EU-27 territory. Those in EU, counts 144 units, with the capacity of 130651 MW(e). It is not surprising, the EU territory is rather small in comparison to Asia or both Americas. It may be said, that factor describing installed capacity per area unit, is the highest for Europe. Especially, when to consideration be taken reactors in countries outside EU membership such as Scandinavia, Switzerland, Ukraine, part of Russia.
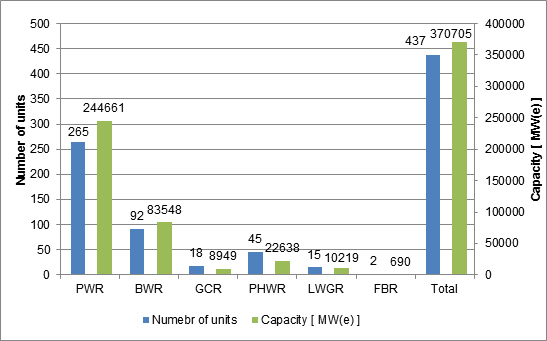
Source: Own development based on "Nuclear Power Reactors in the World, 2010 Edition", International Atomic Energy Agency, Vienna 2010 [9]
Only 55 reactors are under construction now, and 20 of them, so 36% are being constructed in China. All existing and new reactors in numbers, are shown in Fig. 5, 6. Intentionally, Fig. 6. is not properly scaled, but in such graph presentation, share of new reactors in total existing is perfectly visible.
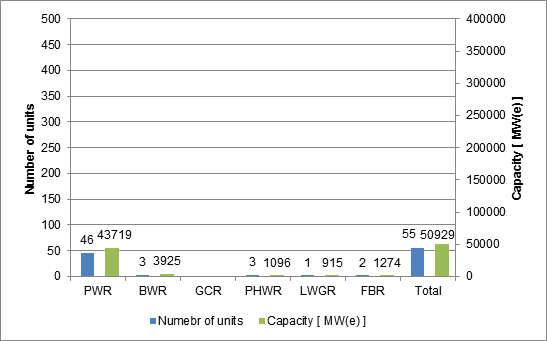
Source: Own development based on "Nuclear Power Reactors in the World, 2010 Edition", International Atomic Energy Agency, Vienna 2010 [9]
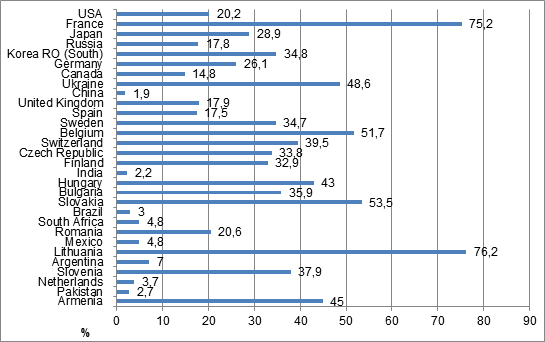
Nuclear electricity generation is not staidly divided in the world, what is shown in the next figure (Fig. 7.). The biggest electricity producer from nuclear energy is the US, France and Japan. But only on one of the listed country mostly relay on nuclear energy. It is France, as 75,2 % electricity used in France is produced by nuclear power plants. All other countries have diversification in generation mix with nuclear share on level from 20, up to 40 per cent. Exception are small country, where a single nuclear power plant ensures electricity on the all territory. In big countries, it is different. For example the US with nuclear electricity generation of almost 800 TWh, covers only 20,2% of its energy market. In Fig. 8. in Lithuania two reactors were shut down due to political reasons. Graphs show production results of year 2009, when those reactors were operating.
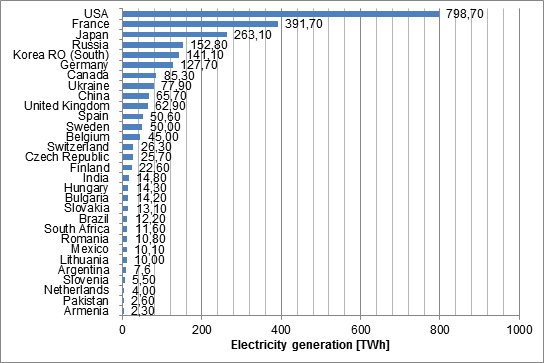
Source: Own development, based on "World Nuclear Power Reactors", WNA - World Nuclear Association http://www.world-nuclear.org/info/reactors.html [10]
Source: Own development, based on "World Nuclear Power Reactors", WNA - World Nuclear Association http://www.world-nuclear.org/info/reactors.html [10]
So what the future of nuclear energy and what its share in the market will be in situation, when there is not many investments in new reactors, electricity demand is growing and the cost of carbon dioxide in EU ETS is continuously increasing, blocking the construction of new coal - fired power plants? The partial answer to this problem can be found in Fig. 9. and 10.
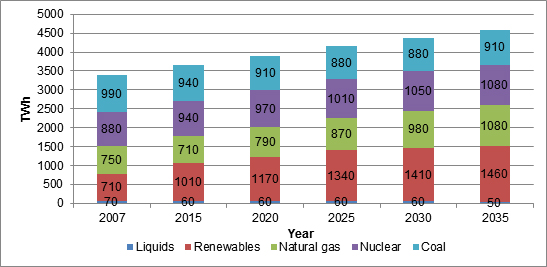
Source: Own development, based on "International Energy Outlook 2010" , U.S. Energy Information Administration, Office of Integrated Analysis and Forecasting U.S. Department of Energy [2]
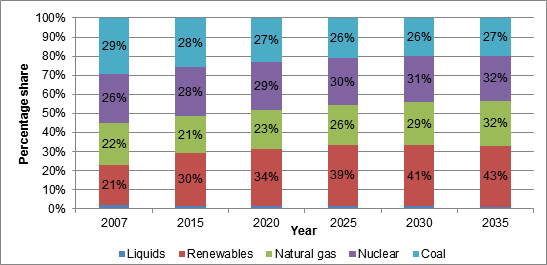
Source: Own development, based on "International Energy Outlook 2010" , U.S. Energy Information Administration, Office of Integrated Analysis and Forecasting U.S. Department of Energy [2]
Figures shows that known, planned investments in new reactors can provide the increase in electricity generation from nuclear energy. It would cause also a rise in share of nuclear electricity generation in total production by 6 percentage points, from 26 % to 32%. But it is not revolution or even "renaissance" of nuclear reactors, because increase in natural gas usage is by 10 percentage points, and in renewables is by 22 percentage points! It indicates, that nuclear energy would be only a transient solution. However assuming than majority of electricity demand can be covered by renewable sources can be incorrect. Why? Estimating, to equal energy generated annually in nuclear power plants with reactor 1600 MW and capacity factor 90%, it is necessary to ensure 1577 units of off-shore wind generators or 3154 units of on-shore wind generators (off-shore works average 4000h, on-shore 2000h annually). Generally, the easiest solution would be to continue electricity generation in coal - fired power plants, with only maintaining the present level of nuclear generation. But due to EU's political it can not come true. The CO2 allowances are too expensive. Until the fusion reaction would not be well controlled, Europe is forced to partial solutions, and choosing between worse and the worst.
-
Nuclear power industry|
Technology|
The electricity supply system aspect|
Economics|
Environment|
Public aspect|
Future|
Legislation|
References|