
TECHNICAL COMPARISON
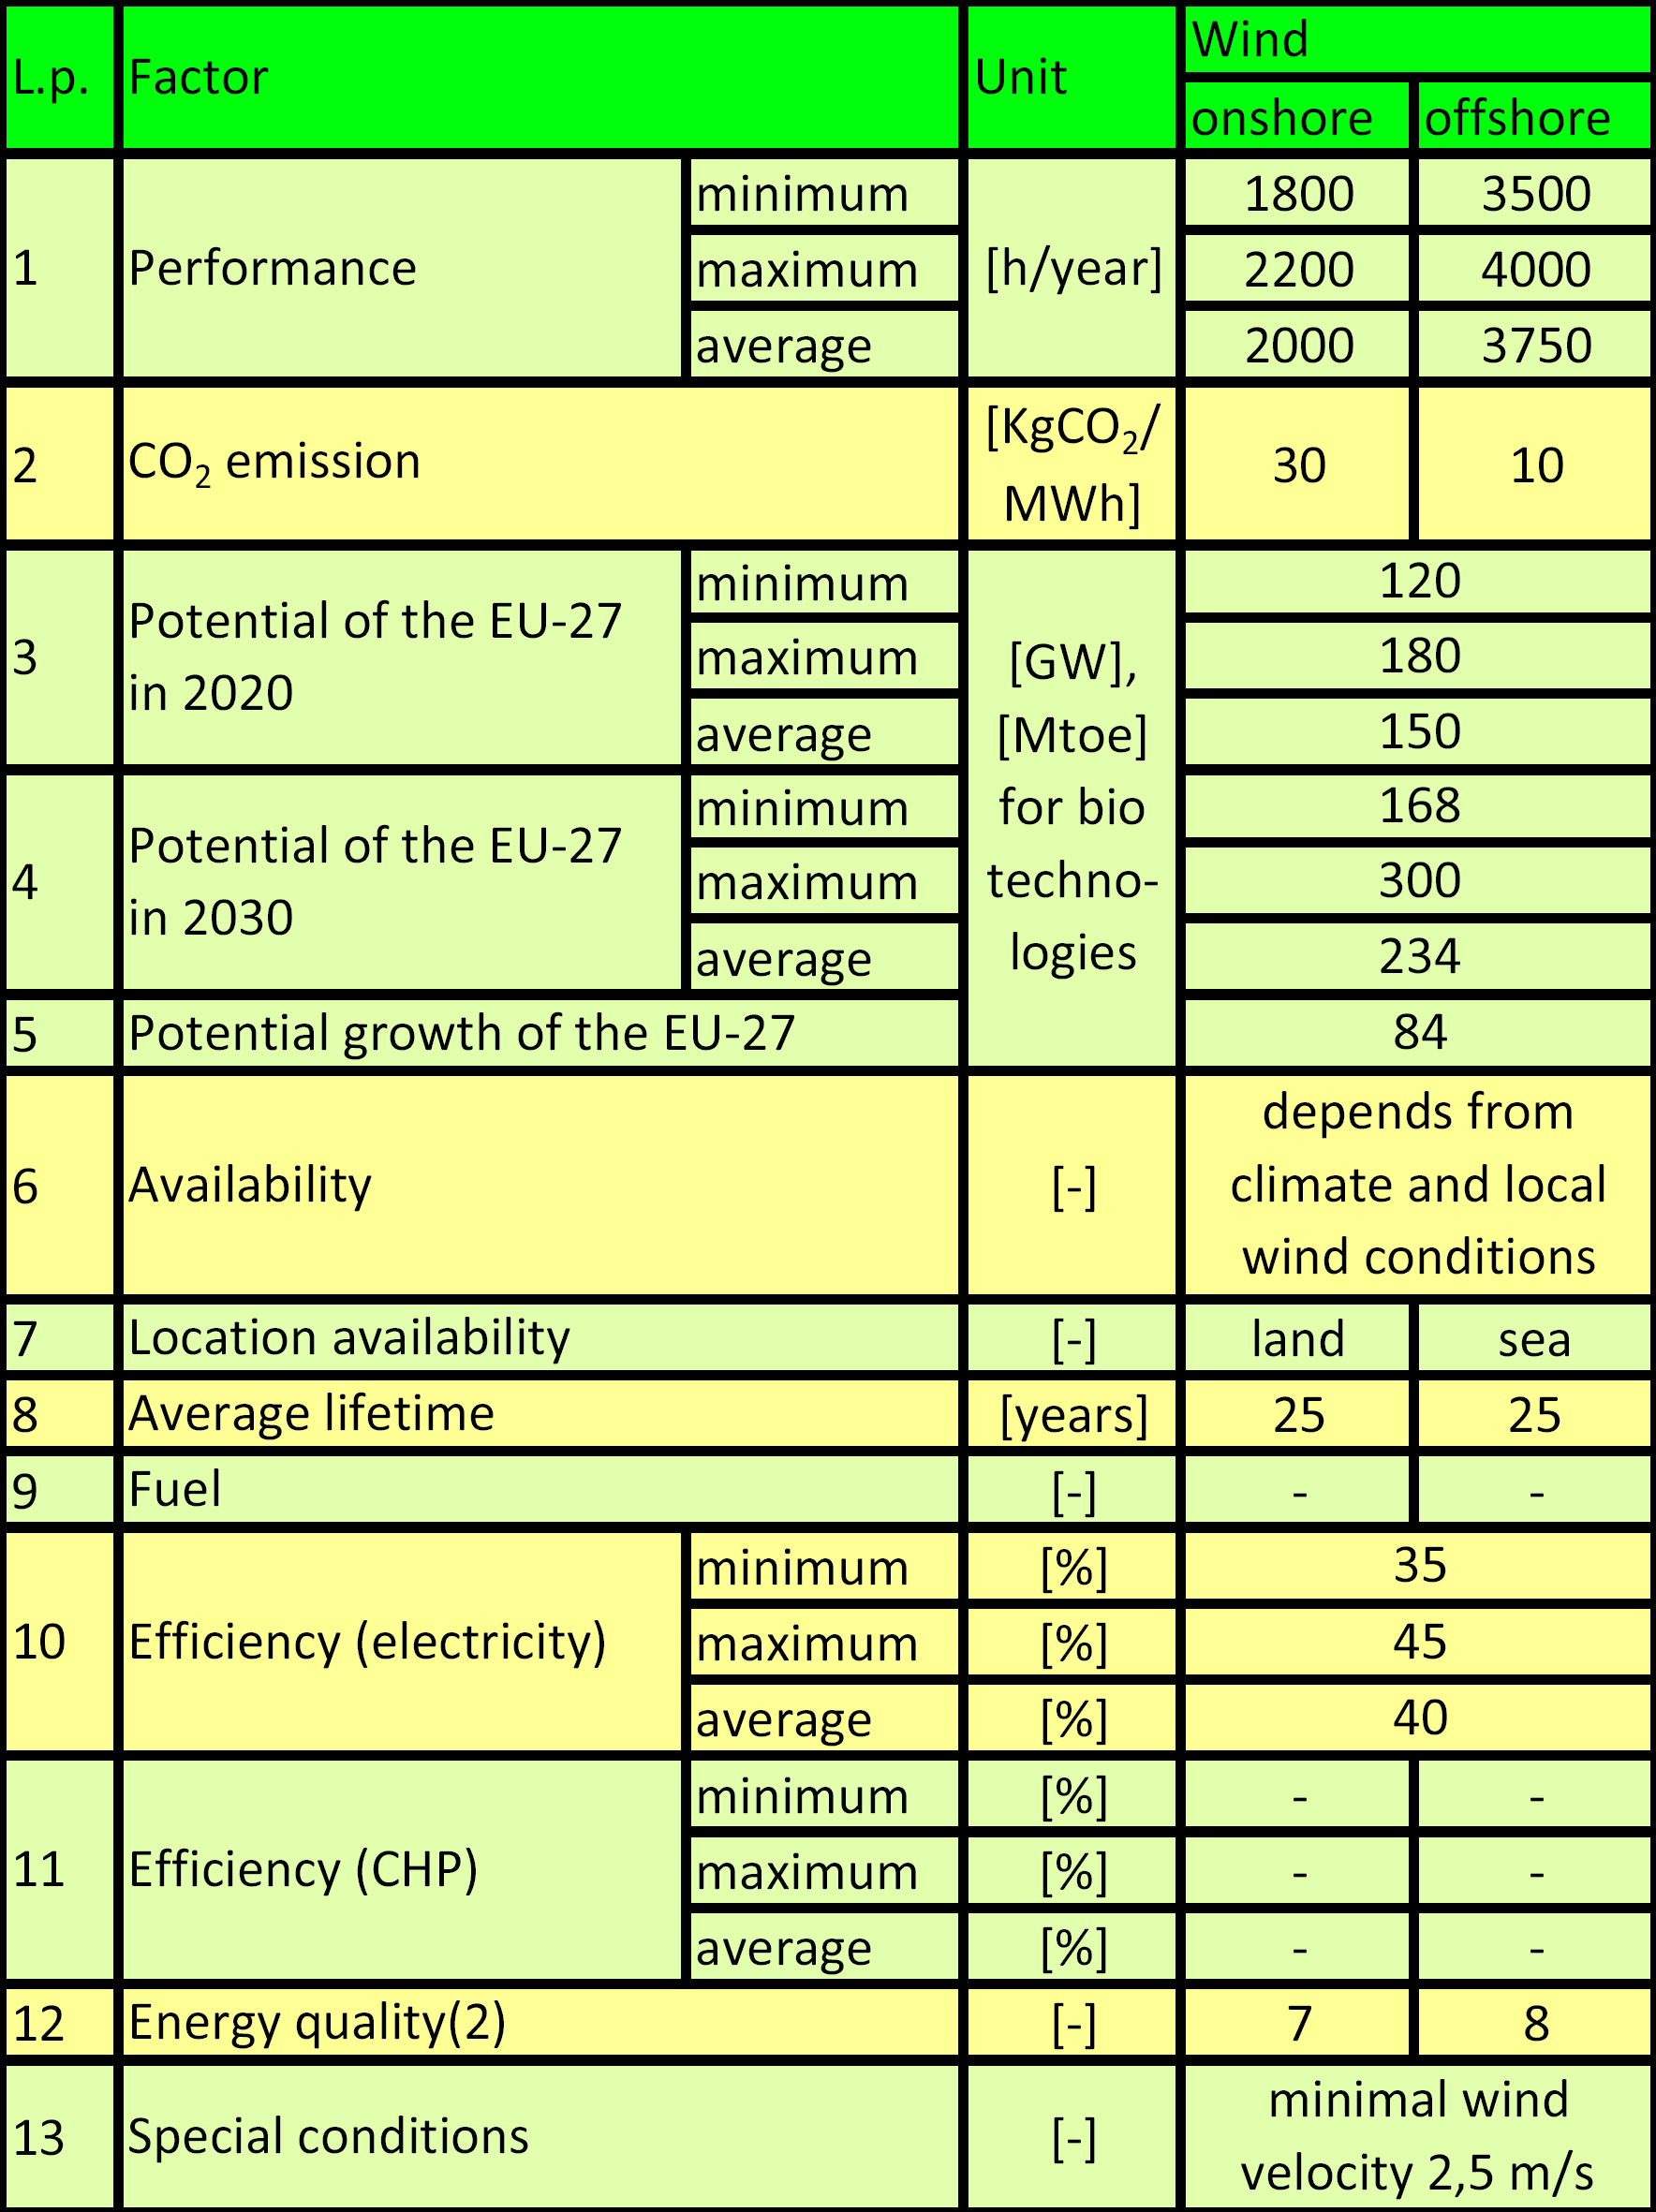
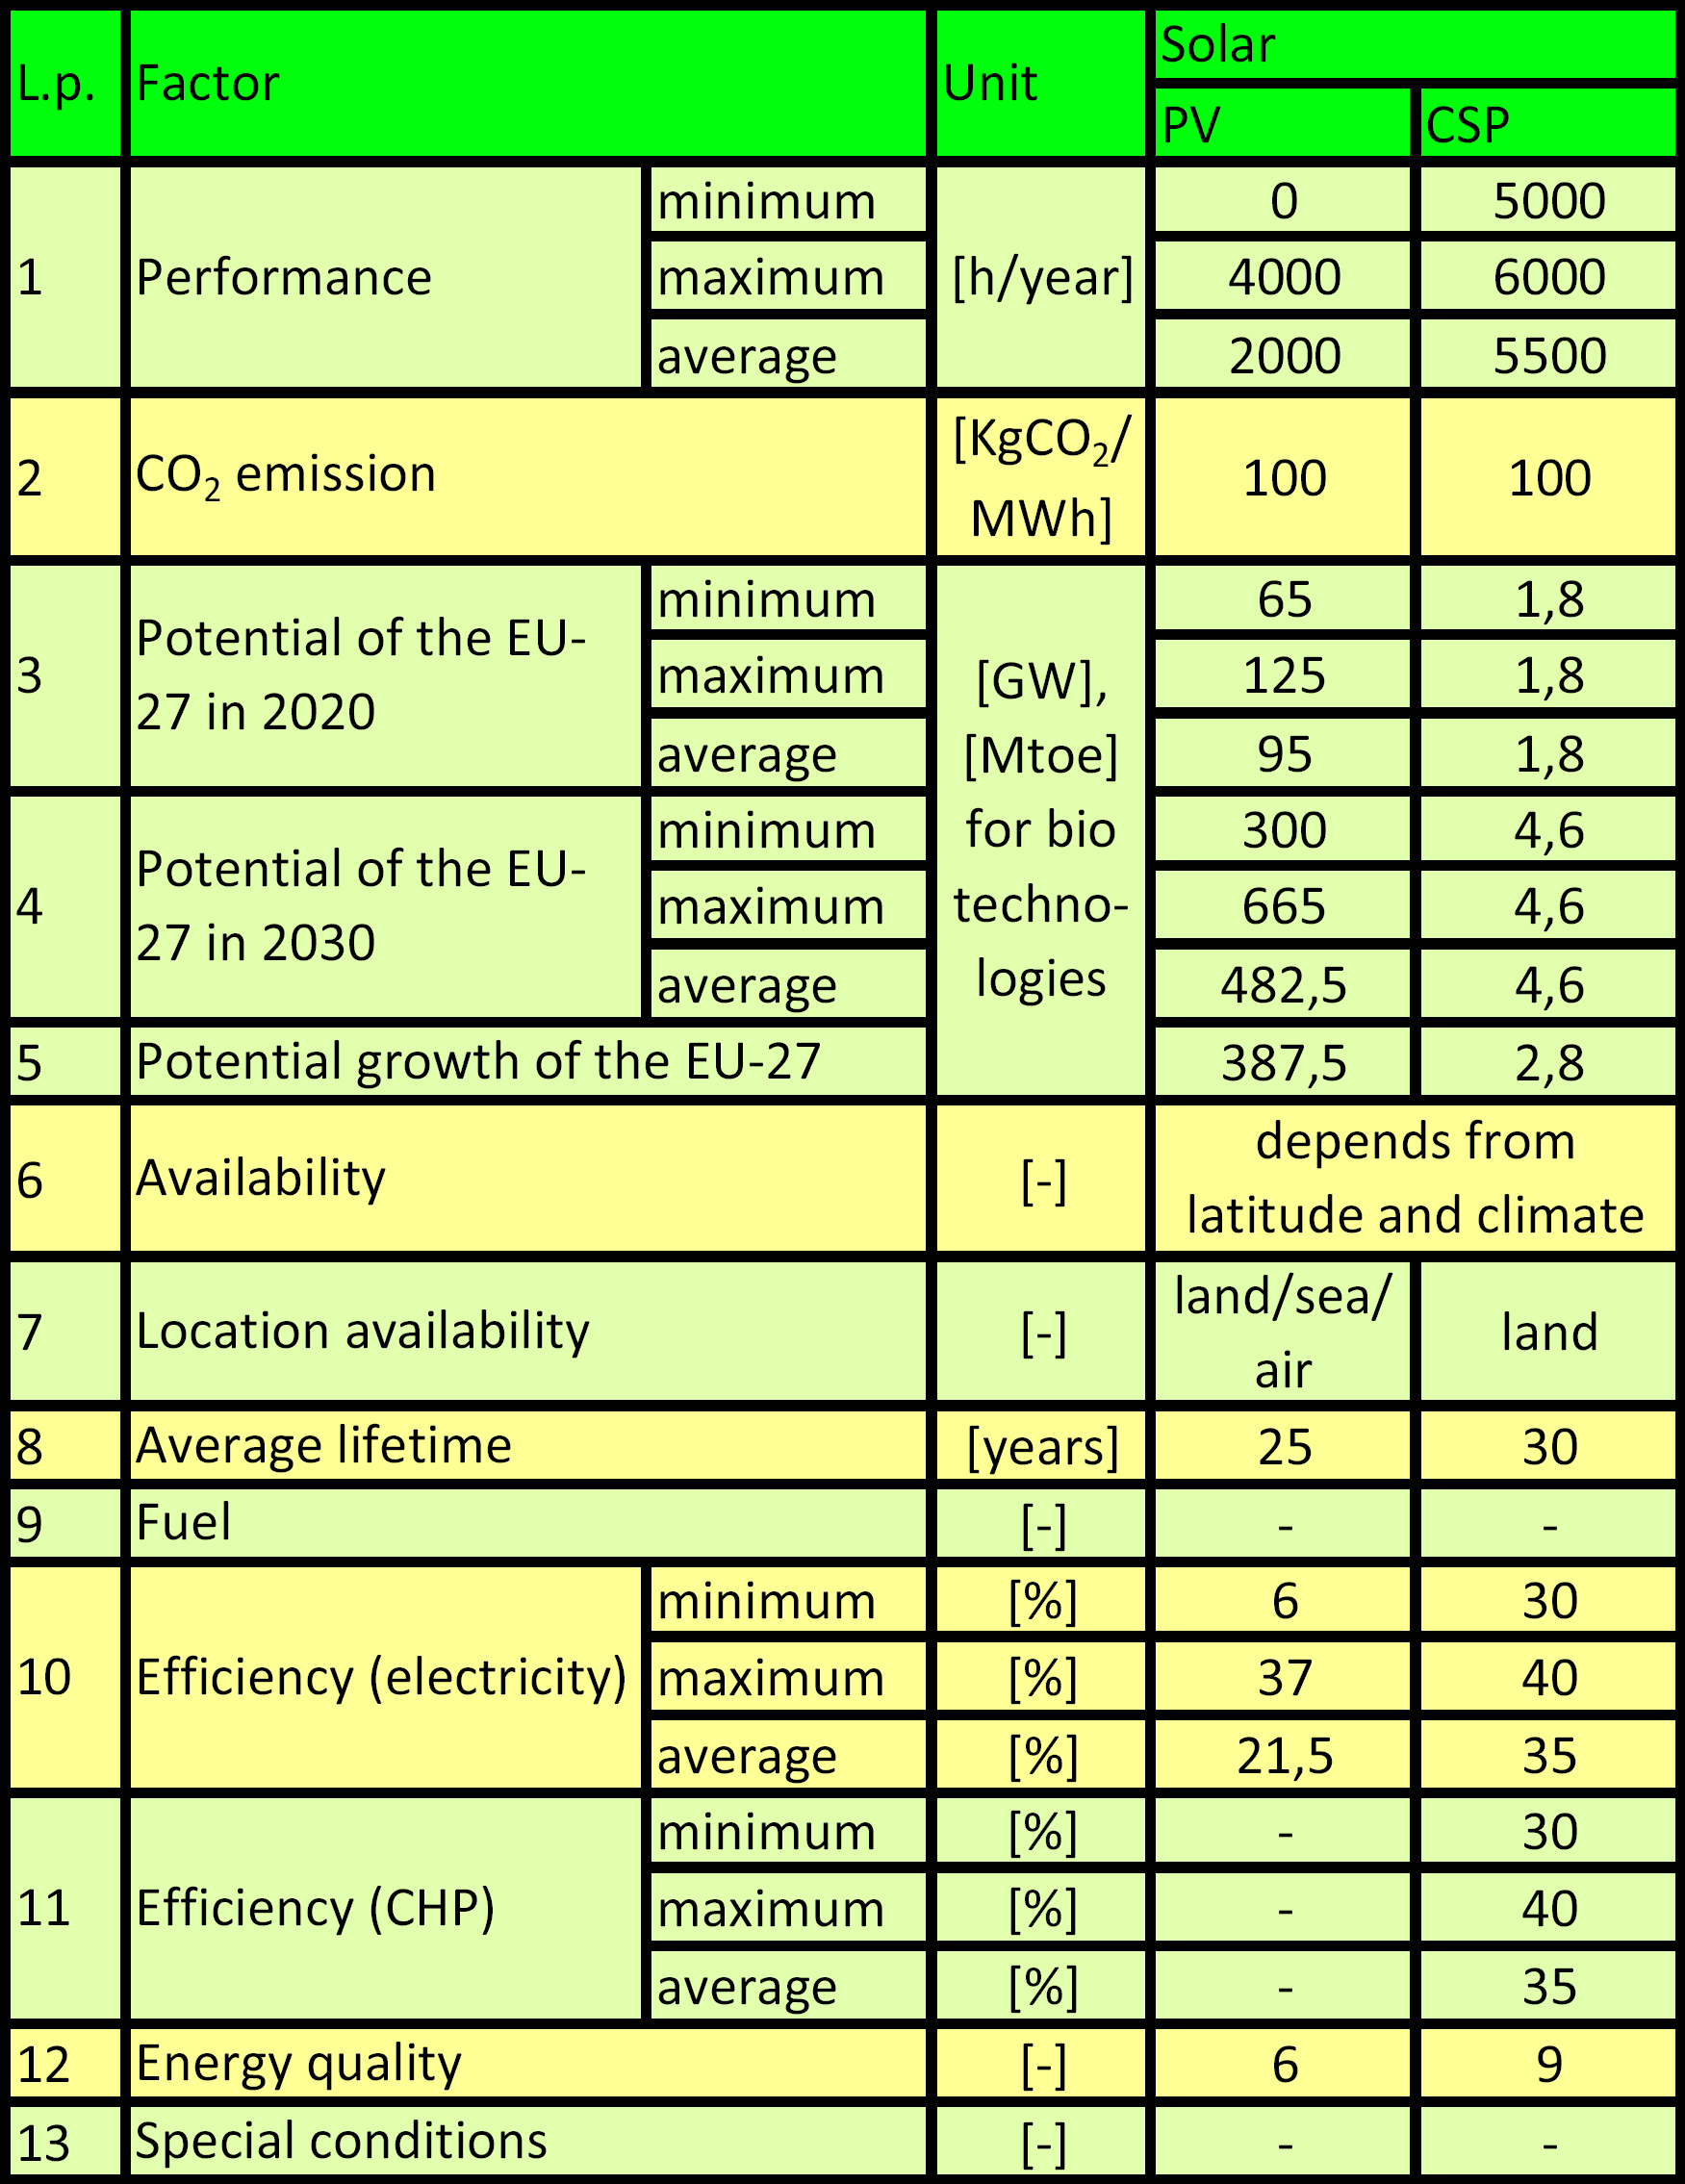
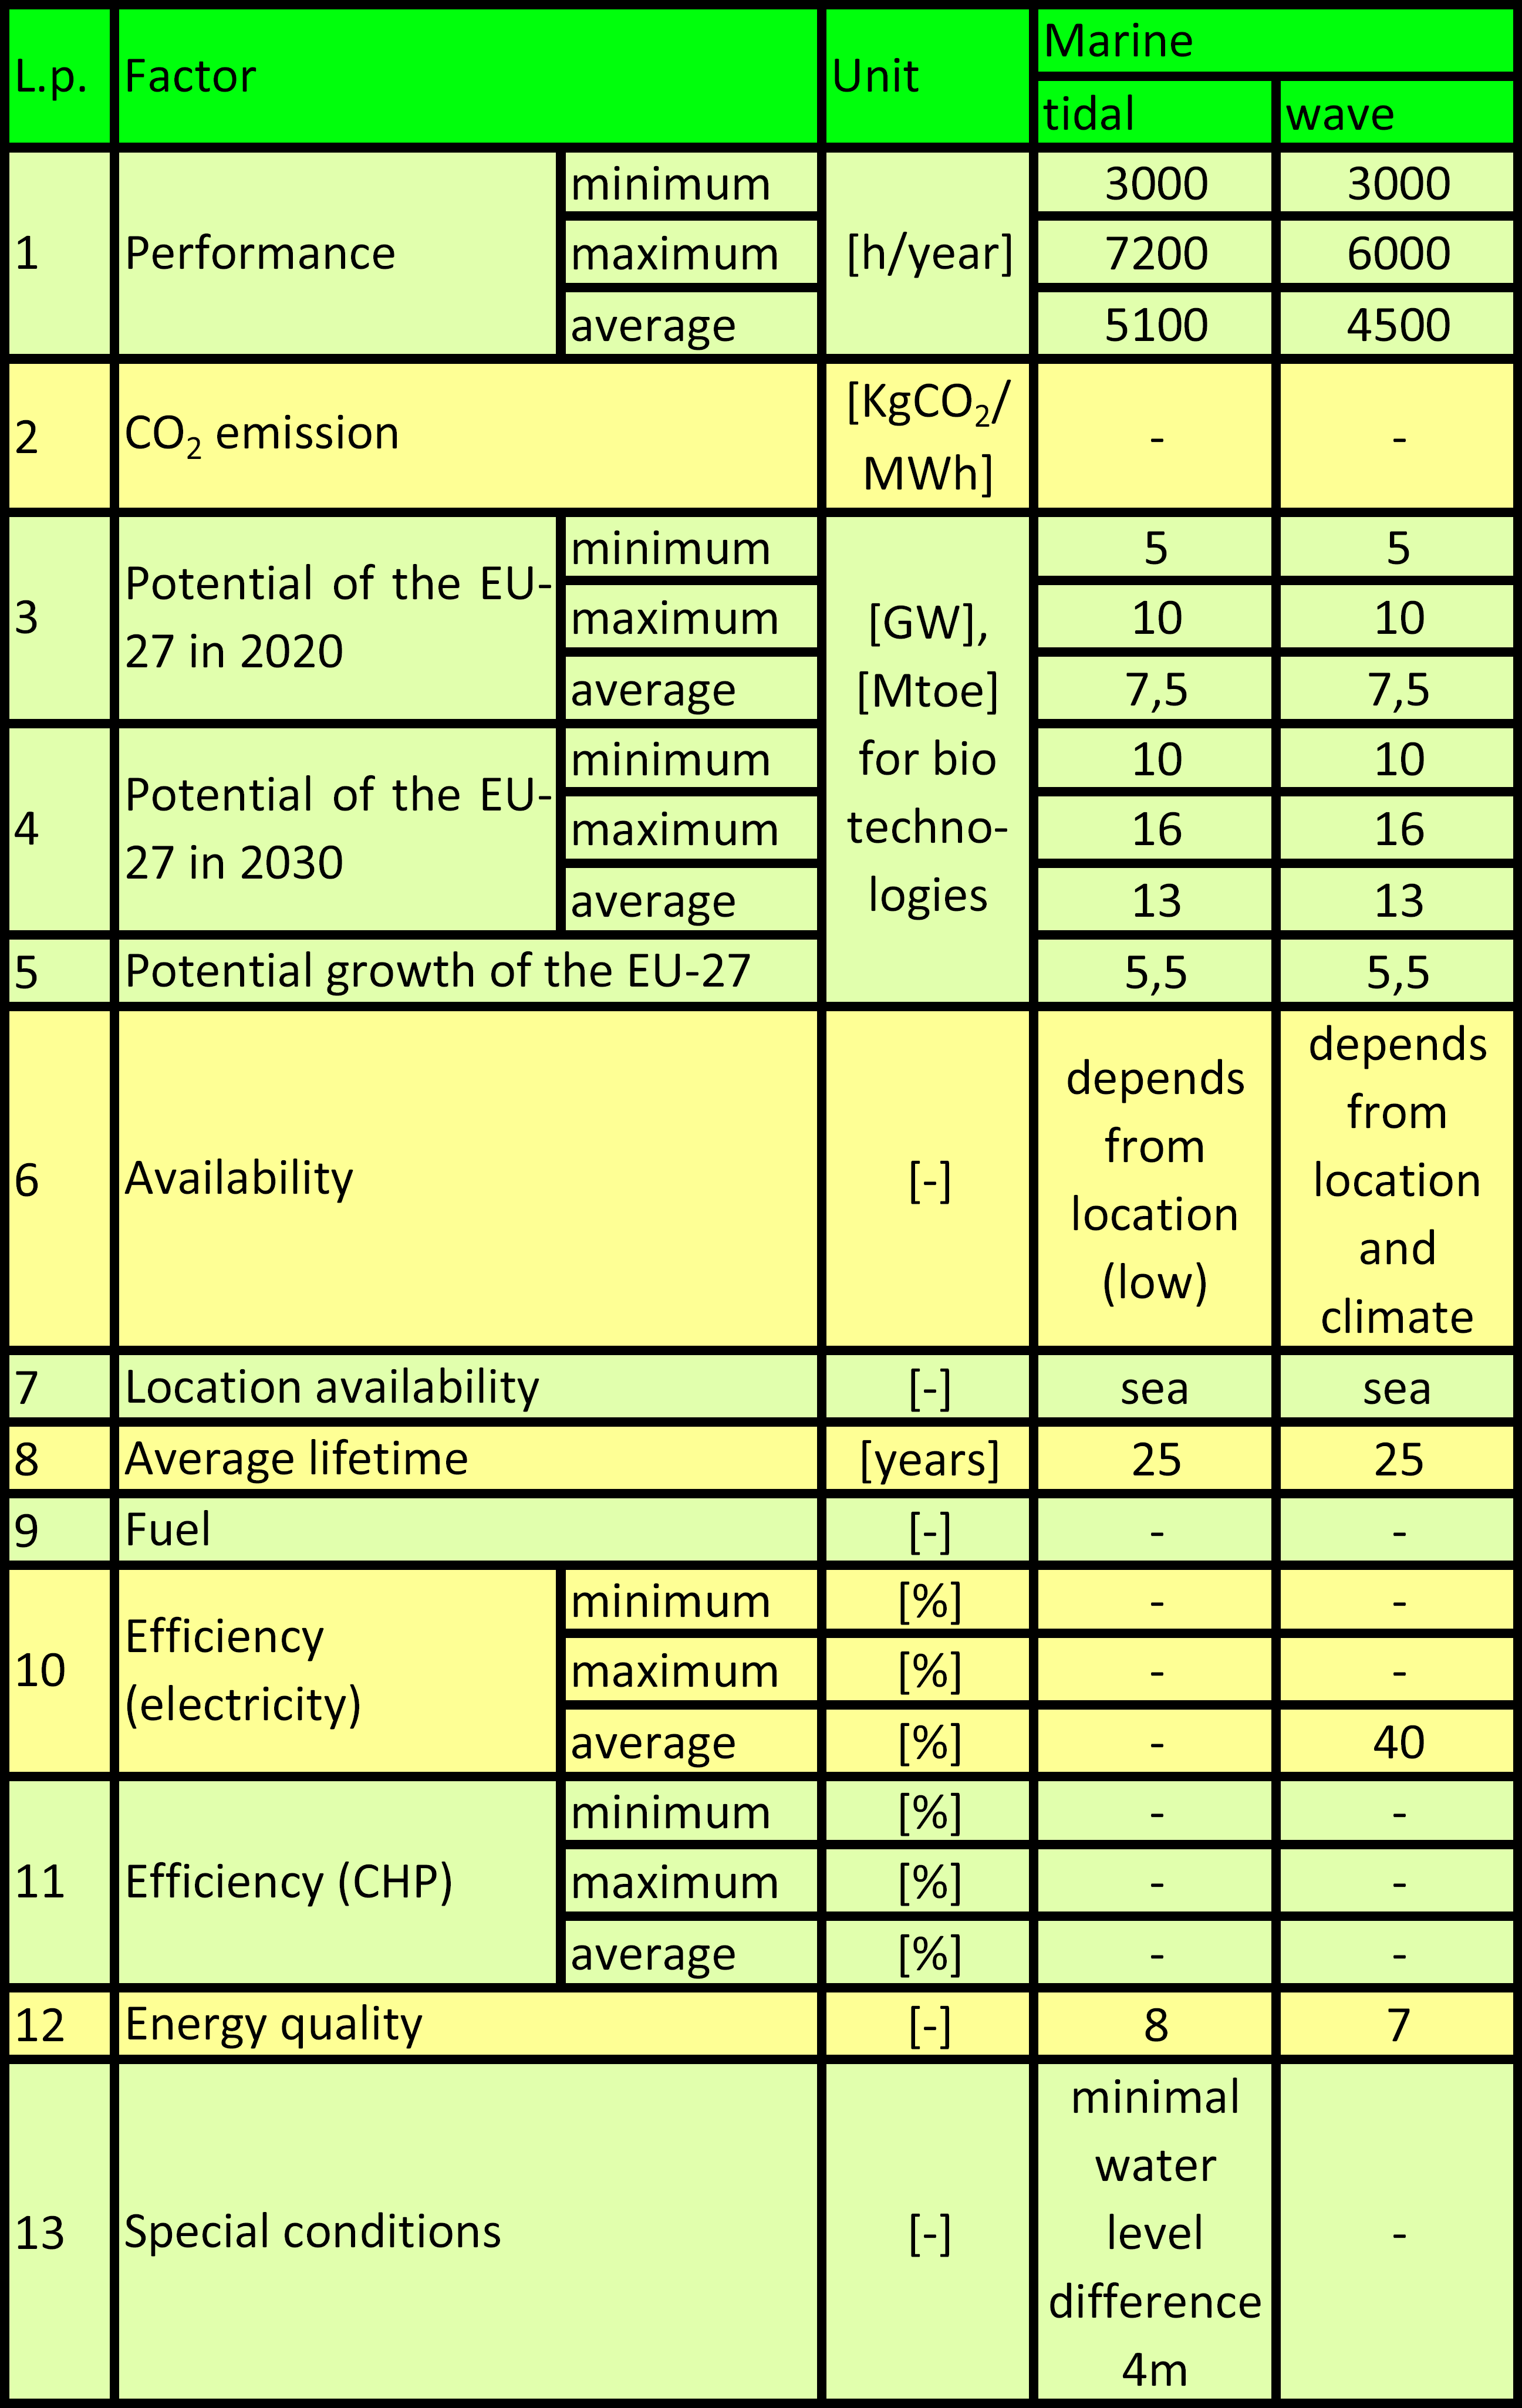
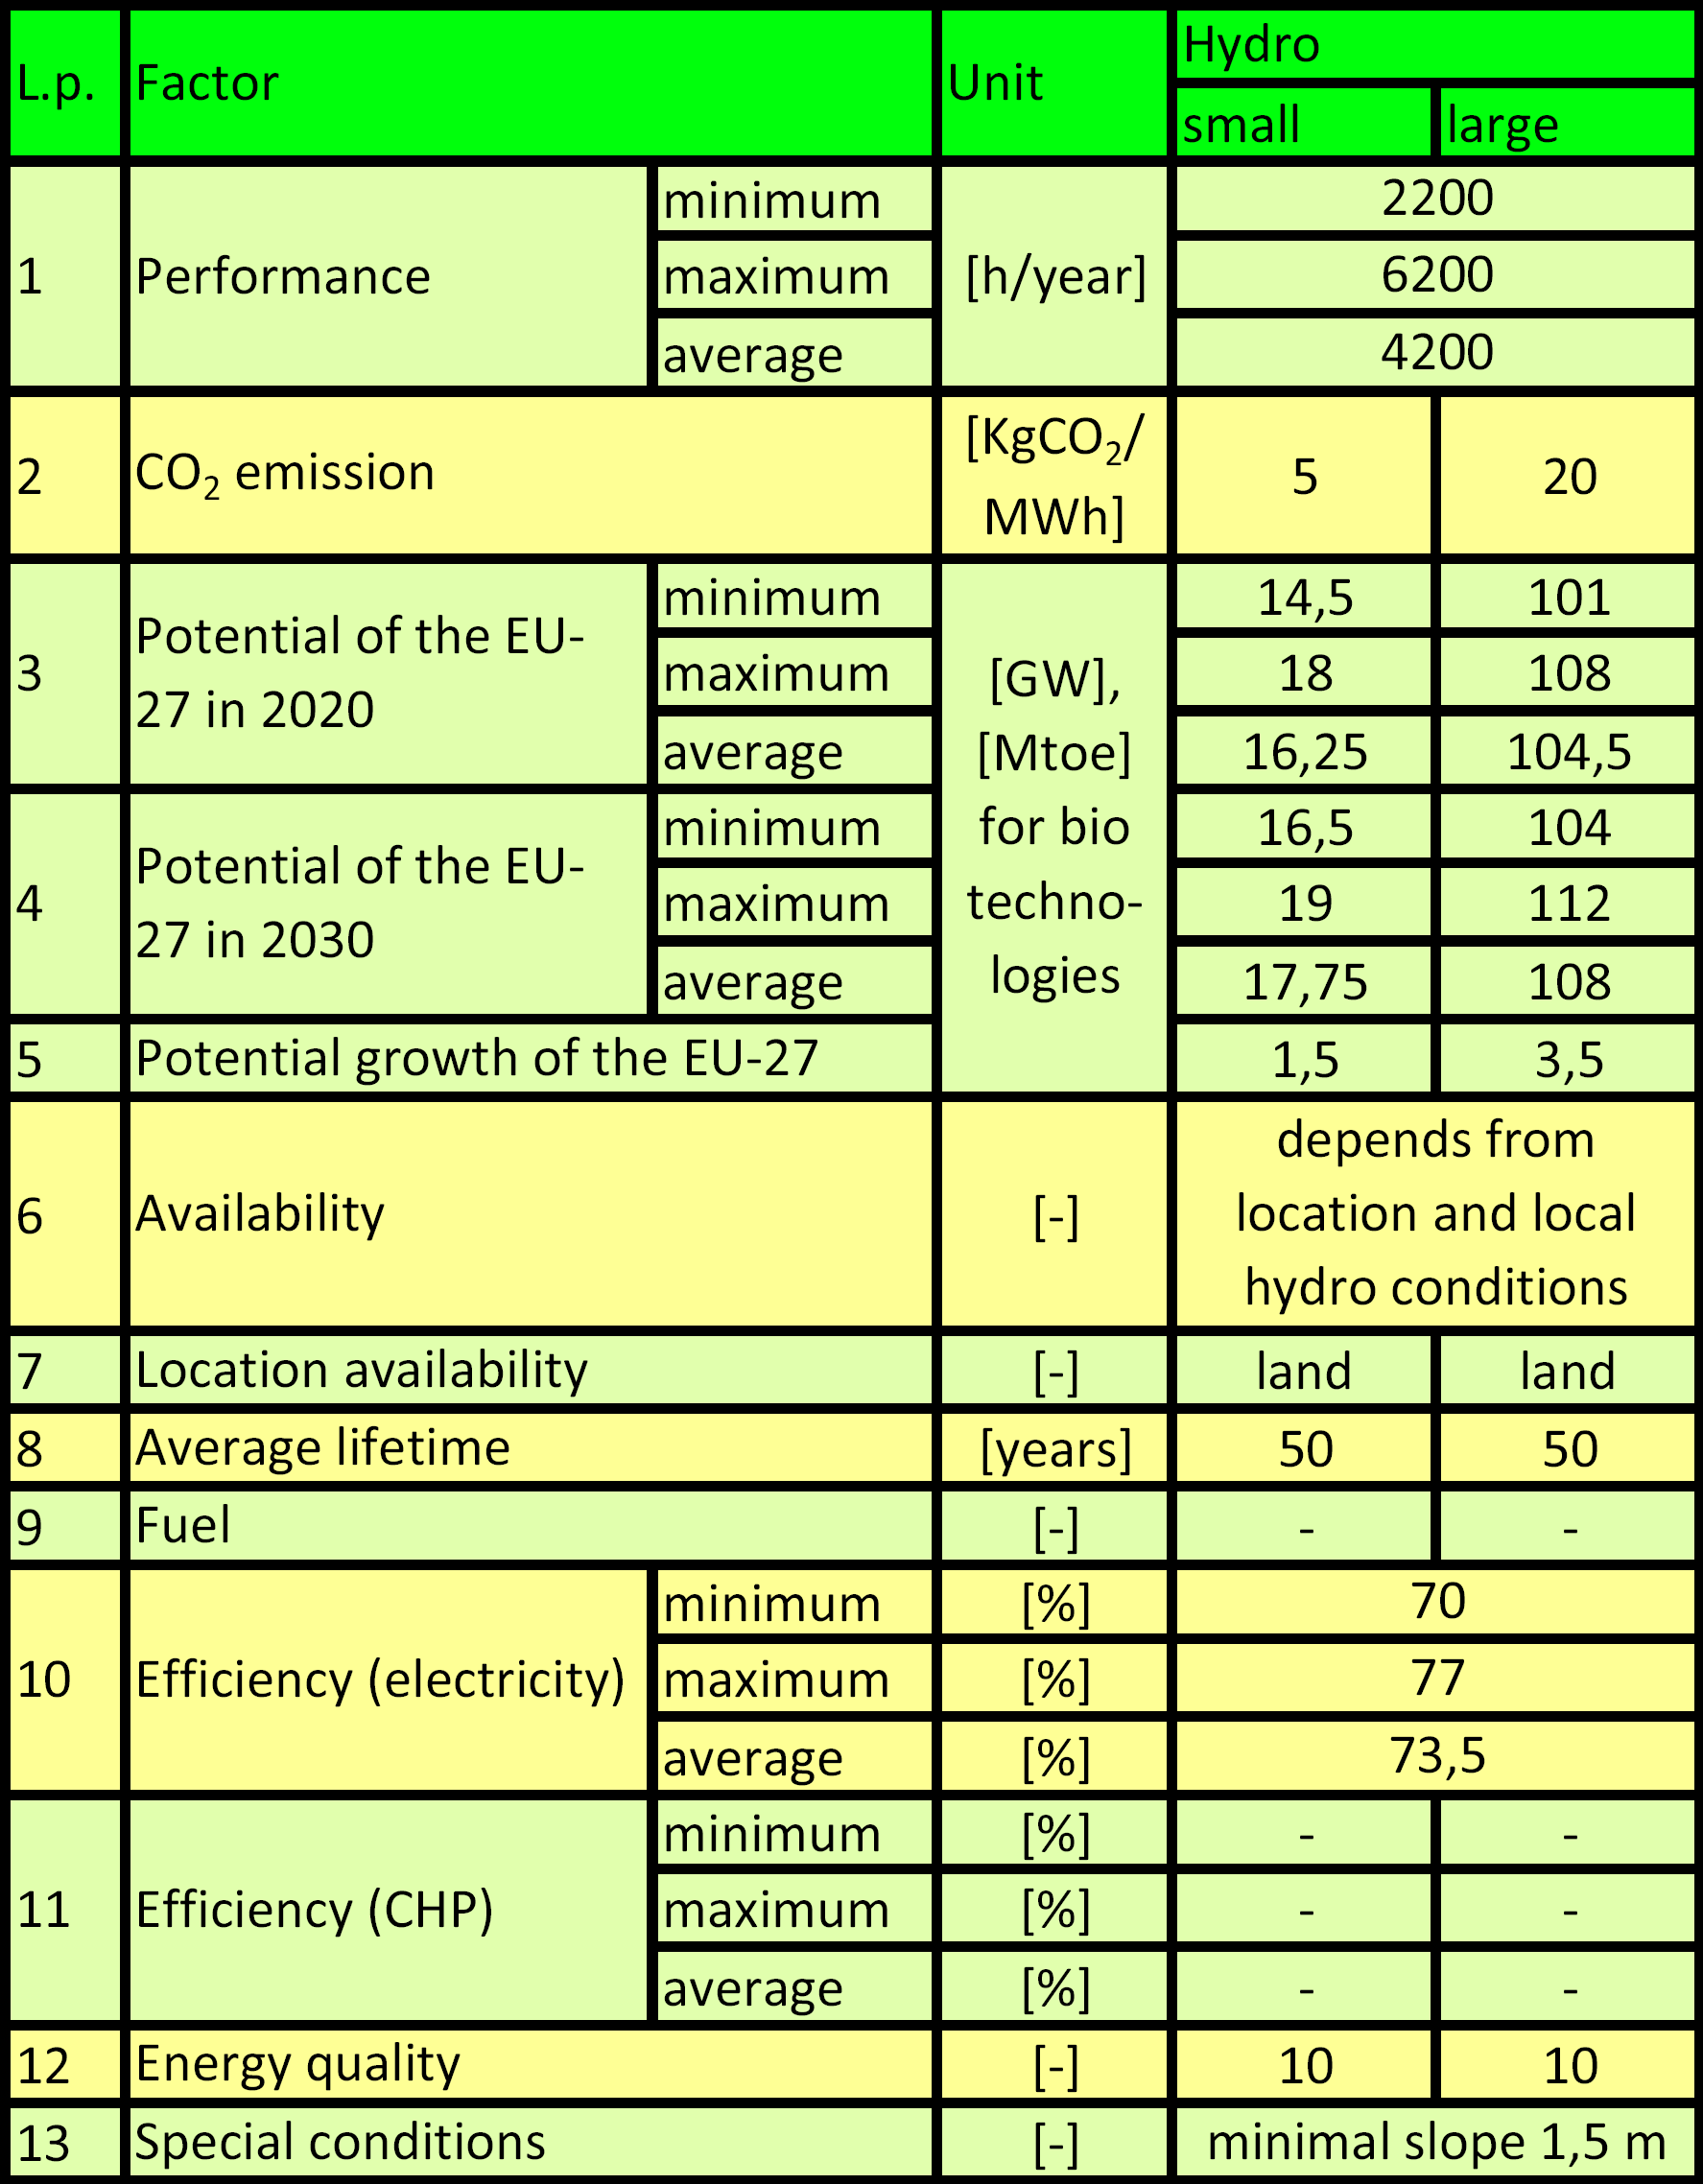
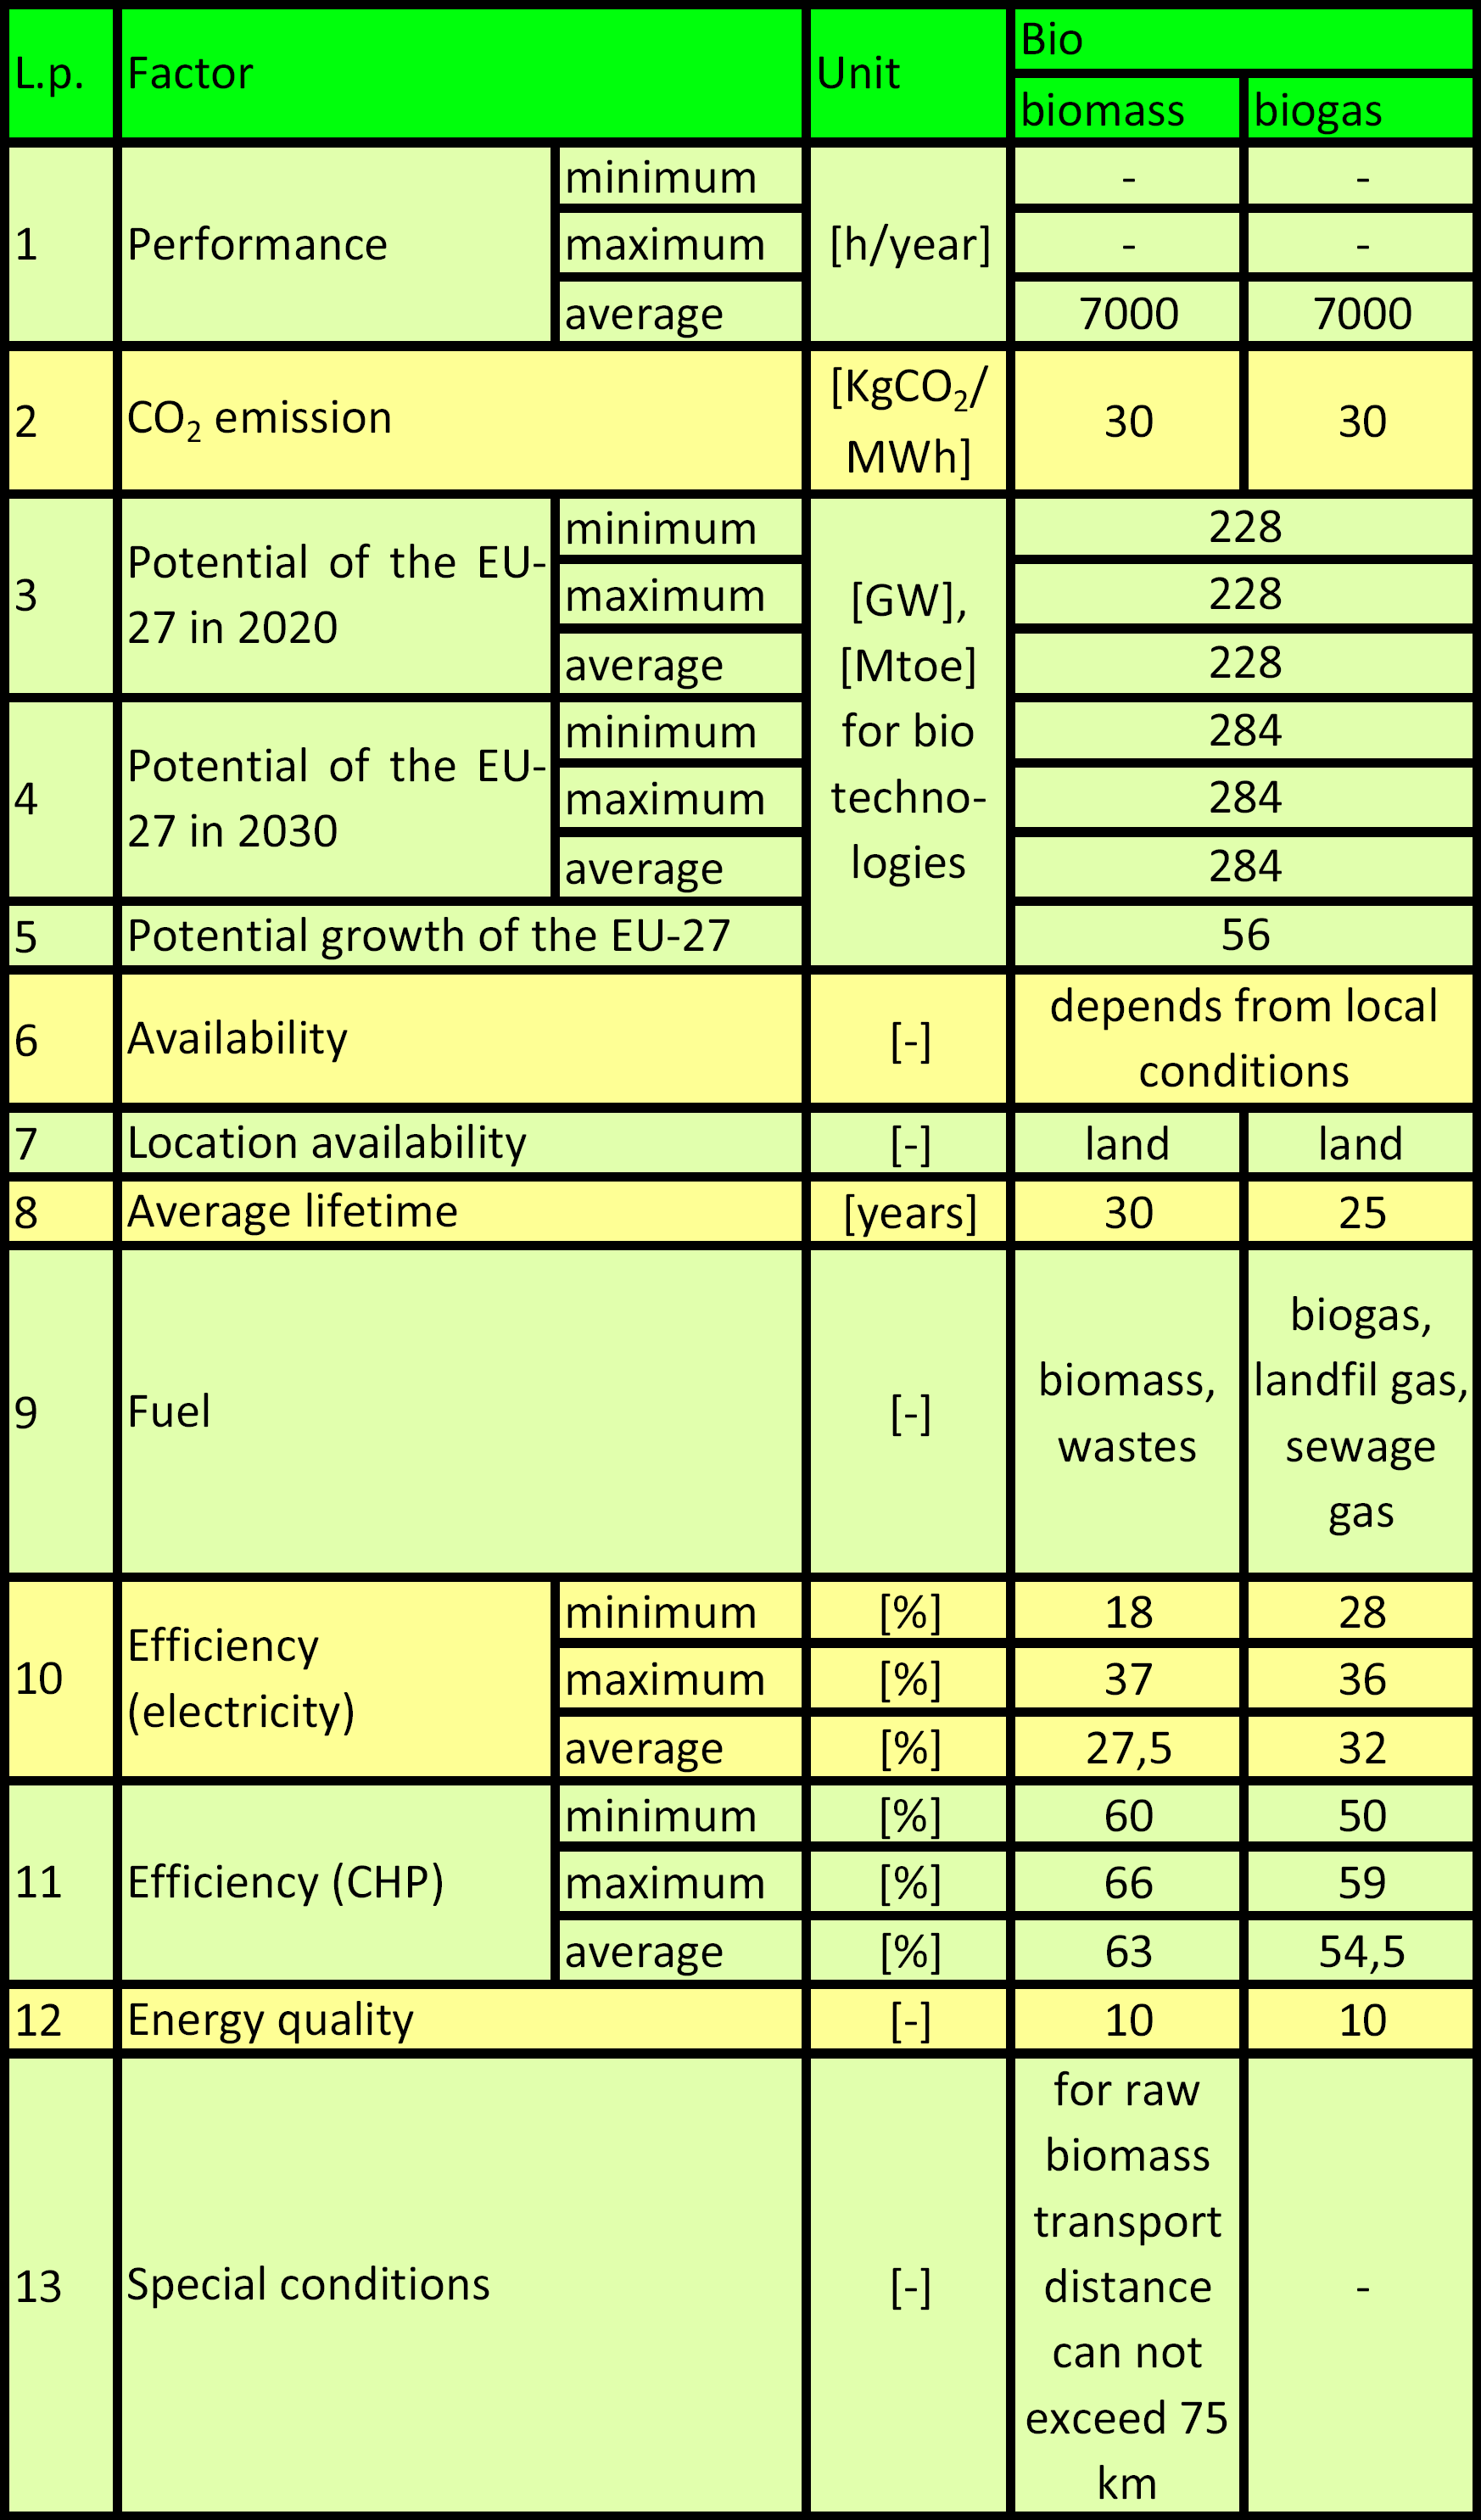
In general all of the RES technologies which are described in that thesis are considerable different each other and do not have so much common properties. Analysis include only the most common of them and minimal, maximal and average values of the most common factors. Therefore in some of case the range of the value can be wide, describes only average quality. 1 Performance describes the minimum, maximum and average value of full load operating hour annual. Value of the factor depends from local wind conditions. 2 CO2 emission is related with direct emission from device plus the GHG emitted during production and construction process. 3 Technical potential which the Member States of the EU can achieve up to 2020. 4 Technical potential which the Member States of the EU can achieve up to 2030. 5 Growth of potential from 2020 up to 2030. Relatively high in case of new technologies which are on the beginning of their development. 6 Availability describes basic requirements (e.g. fuel dependence) which are necessary for profitable solution. 7 The areas and regions where are possibility for each investment. 8 Average operating time during which power plant can operate without serious failure. 9 Type of fuel. 10 Minimum, maximum and average efficiency which can be achieved by power plant if only electricity is generated. 11 Minimum, maximum and average efficiency which can be achieved by power plant in case of the CHP systems. 12 Energy quality described in scale from 0 (in case of the lowest quality of electricity) up to 10 (in case of the highest quality of electricity) designated by author. 13 Additional requirements which have to met for profitable investment.
Wind power
Solar power
Additional informations
- In case of the PV systems, the minimal value (0) is related with wide range of application (from small cell in e.g. calculators, to large power plants).
- In case of the PV systems, location on land, see and air results from wide range and flexibility of structure and application solutions. The PV cells are mounted on ground, building, special ground structures (e.g. towers), platforms (on seas), ships, plains, balloons, artificial satellite etc.
Wave and tidal power
Additional informations
- Marine technologies are relatively new therefore accurate value of the GHG emission is not know yet.
- Efficiency of the marine technologies still are unknown but probably in case of the TSG is similar with efficiency of wind turbine.
Hydro power
Bio power
-
Description of technology|
Economic aspects|
Environment and public awareness|
Legislation|
Final comparison|
References